The rich-poor gap in India
Why in News?
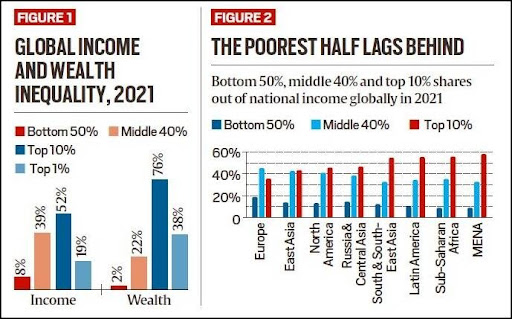
- Recently, the latest World Inequality Report flags India as a poor and very unequal country, with the top 10% holding 57% of national income in 2021, and the bottom 50% holding just 13%.
Key findings for India:
- India stands out as a “poor and very unequal country, with an affluent elite”, where the top 10% holds 57% of the total national income, including 22% held by the top 1%, while the bottom 50% holds just 13% in 2021, according to the World Inequality Report 2022.
- It says India’s middle class is relatively poor with an average wealth of Rs 7,23,930, or 29.5% of the total national income, compared with the top 10% and 1% who own 65% (Rs 63,54,070) and 33% (Rs 3,24,49,360), respectively.
- The average annual national income of the Indian adult population is Rs 2,04,200 in 2021. The bottom 50% earned Rs 53,610, while the top 10% earned over 20 times more (Rs 11,66,520), the report states.
- The average household wealth is Rs 9,83,010, of which the bottom 50% owns Rs 66,280, a mere 6%.

- The share of the top 10% and bottom 50% in pre-tax national income has remained broadly constant since 2014.
- The quality of inequality data released by the government has seriously deteriorated, making it particularly difficult to assess recent inequality changes, the report says.
- As per the recent Multidimensional Poverty Index prepared by Niti Aayog, one in every four people in India was multidimensionally poor.
- Bihar has the highest such proportion (51.91%), followed by Jharkhand (42.16%) and Uttar Pradesh (37.79%).
Pandemic impact
- The impact of the pandemic was reflected in a drop in global income, which was impacted significantly due to India.
- The report said that When India is removed from the analysis, it appears that the global bottom 50 per cent income share actually slightly increased in 2020.
- Also, even as countries have become richer over the last 40 years, their governments have become significantly poorer, a trend magnified due to the pandemic.
- The share of wealth held by public actors is close to zero or negative in rich countries, meaning that the totality of wealth is in private hands.
- The Report said, this trend has been magnified by the Covid crisis, during which governments borrowed the equivalent of 10-20 per cent of GDP, essentially from the private sector.
- The rise in private wealth has also been unequal within countries and at world levels. Since the mid-1990s, the top 1% globally took 38% of all additional wealth accumulated, whereas the bottom 50 per cent captured just 2%.
- “The wealth of the richest individuals on earth has grown at 6 to 9% per year since 1995, whereas average wealth has grown at 3.2% per year. This increase was exacerbated during the COVID pandemic.
Other key inequalities
- Women’s share of total incomes from work was about 30% in 1990, and is less than 35% now, the report notes.
- Inequalities within countries are now greater than those between countries. Within countries, the gap between the average incomes of the top 10% and the bottom 50% almost doubled from 18 times in 1820 to 41 times in 1910, reaching an all-time high of 53 in 1980 and 50 in 2000, before declining to 38 in 2020.
- It notes that global income and wealth inequalities are “tightly connected to ecological inequalities and to inequalities in contributions to climate change”.
- The top 10% of emitters is responsible for close to 50% of all emissions, while the bottom 50% contributes 12%.
Reference:
Subscribe
Login
0 Comments
